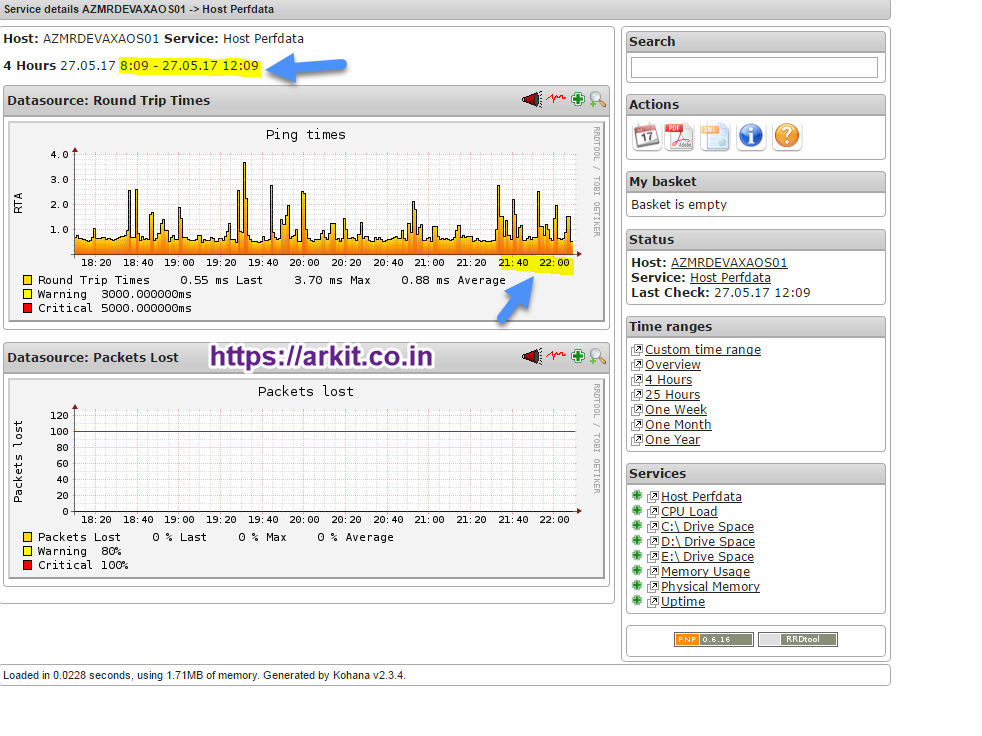
Nagios Core Graphs Showing Incorrect Time – Resolved
We are using Nagios Core for Monitoring our entire environment which consist of Windows/Linux/MAC/Unix and Storage Devices. Recently i observed an error in pnp4nagios graphs after changing Nagios server timezone. Nagios Core Graphs showing Incorrect Time.
As shown in above picture One entry is showing like 8 Hours and another is showing like 21 Hours. I thought maybe correct due to format change like 24 hours and 12 hours but morning 8 hours is not considered as 20 Hours or 21 Hours. Completely wrong data showing.
Basically i thought its an timezone difference (Example: Malaysia (MYT) – India Standard Time (IST) but not matching.
Resolution Nagios Core Graphs Showing Incorrect Time
Step1: Check Current Server time and match with timezone. Note (Keep Ready) Timezone name.
Step2: You know PNP4Nagios will run/depend on PHP. Go to /etc/php.ini PHP configuration file and find the string name called date.timezone un-comment it and add your timezone.
# vi /etc/php.ini

[Date]
; Defines the default timezone used by the date functions
 ; http://php.net/date.timezone
 date.timezone = Australia/Brisbane <-- mention timezone

:wq
Step3: Now you need to restart Web Services and check the graphs
# service httpd restart
Or
# systemctl restart httpd.service
Hurray.!! Issue resolved and Nagios Core Graphs Showing Incorrect –> Correct Time. Looks to be simple but simple trick/tweak can’t be an ready made solution. After this article it is ready made solution for you.
Thanks. Please do comment your feedback about this blog/web site.
Related Nagios Core Tutorial
Core Installation and Configuration in RHEL 7
Nagios Windows Client installation and configuration
PNP4NAgios Graphing service installation and configuration
Core Upgrade to Latest version Steps
Thanks for your wonderful Support and Encouragement
- Get Email | Download E-Books
- Facebook Page
- Youtube Channel
- Exclusive Telegram Group
- Discuss On WhatsApp Group


