pnp4Nagios Installation configuration Step by step Guide
Pnp4Nagios is an tool which will store performance data into RRD (Round Robin Database) and show in graphical representation. Its easy to understand and represent the values in graphs. Let’s see pnp4nagios installation configuration Step by Step guide.
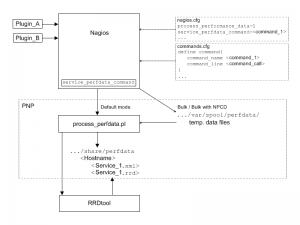
Perf Data Flow to RRD Database is below
There are three modes of data collection Using pnp4nagios
- Default mode
- Bulk Mode
- Bulk with NPCD mode
Configure Local Yum Repository and Install rrdtool necessary (dependency)
# yum install rrdtool
# yum install ruby xorg-x11-fonts-Type1
# cd /tmp
# wget https://sourceforge.net/projects/pnp4nagios/files/PNP-0.6/pnp4nagios-0.6.25.tar.gz
# tar -xvf pnp4nagios-0.6.25
# cd pnp4nagios-0.6.25
# ./configure --with-rrdtool=/usr/bin/rrdtool
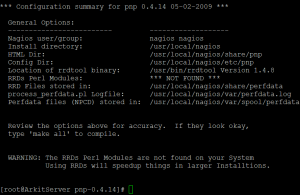
Note: Do not download pnp-0.4-14 which does not work properly
# make all
# make fullinstall
Sure that No errors while installing
Edit the /usr/local/nagios/etc/nagios.cfg file and make sure enabled below config lines for sync mode (Default Mode)
# vi /usr/local/nagios/etc/nagios.cfg
process_performance_data=1

enable_environment_macros=1

host_perfdata_command=process-host-perfdata
service_perfdata_command=process-service-perfdata
# rm -rf /usr/local/pnp4nagios/share/install.php
Now you can see below error
pnp4nagios installation Please check the documentation for information about the following error.

perfdata directory "/usr/local/pnp4nagios/var/perfdata/" is empty. Please check your Nagios config. <a href="http://docs.pnp4nagios.org/faq/3">Read FAQ online</a>

file [line]:

application/models/data.php [109]:

back
Above error will appear when your using sync mode with Nagios Core 4.x version, because pnp4nagios is not compatible with sync mode you have to change in to bulk mode then it work like charm. To Change from sync mode to bulk mode to below steps
# Comment Below Lines
#host_perfdata_command=process-host-perfdata
#service_perfdata_command=process-service-perfdata


# Add Below Lines
# service performance data
#
service_perfdata_file=/usr/local/pnp4nagios/var/service-perfdata
service_perfdata_file_template=DATATYPE::SERVICEPERFDATA\tTIMET::$TIMET$\tHOSTNAME::$HOSTNAME$\tSERVICEDESC::$SERVICEDESC$\tSERVICEPERFDATA::$SERVICEPERFDATA$\tSERVICECHECKCOMMAND::$SERVICECHECKCOMMAND$\tHOSTSTATE::$HOSTSTATE$\tHOSTSTATETYPE::$HOSTSTATETYPE$\tSERVICESTATE::$SERVICESTATE$\tSERVICESTATETYPE::$SERVICESTATETYPE$
service_perfdata_file_mode=a
service_perfdata_file_processing_interval=15
service_perfdata_file_processing_command=process-service-perfdata-file

#
# host performance data starting with Nagios 3.0
#
host_perfdata_file=/usr/local/pnp4nagios/var/host-perfdata
host_perfdata_file_template=DATATYPE::HOSTPERFDATA\tTIMET::$TIMET$\tHOSTNAME::$HOSTNAME$\tHOSTPERFDATA::$HOSTPERFDATA$\tHOSTCHECKCOMMAND::$HOSTCHECKCOMMAND$\tHOSTSTATE::$HOSTSTATE$\tHOSTSTATETYPE::$HOSTSTATETYPE$
host_perfdata_file_mode=a
host_perfdata_file_processing_interval=15
host_perfdata_file_processing_command=process-host-perfdata-file
Check it out after few minutes you can see the data
Verify perfdata path it will create an .rrd and xml files when graphing is working fine
[root@ArkitServer localhost]# ls
Current_Load.rrd Current_Users.rrd _HOST_.rrd HTTP.rrd PING.rrd Root_Partition.rrd SSH.rrd Swap_Usage.rrd Total_Processes.rrd
Current_Load.xml Current_Users.xml _HOST_.xml HTTP.xml PING.xml Root_Partition.xml SSH.xml Swap_Usage.xml Total_Processes.xml
[root@ArkitServer localhost]# pwd
/usr/local/pnp4nagios/var/perfdata/localhost
Verify the pnp4nagios installation status using below command
./verify_pnp_config_v2.pl -m bulk -c /usr/local/nagios/etc/nagios.cfg -p /usr/local/pnp4nagios/etc/

[OK ] PERFDATA template looks good
[OK ] service_perfdata_file_mode is defined
[OK ] service_perfdata_file_mode=a
[OK ] service_perfdata_file_processing_interval is defined
[OK ] service_perfdata_file_processing_interval=15
[OK ] service_perfdata_file_processing_command is defined
[OK ] service_perfdata_file_processing_command=process-service-perfdata-file
[OK ] host_perfdata_file is defined
[OK ] host_perfdata_file=/usr/local/pnp4nagios/var/host-perfdata
[OK ] host_perfdata_file_template is defined
[OK ] host_perfdata_file_template=DATATYPE::HOSTPERFDATA\tTIMET::$TIMET$\tHOSTNAME::$HOSTNAME$\tHOSTPERFDATA::$HOSTPERFDATA$\tHOSTCHECKCOMMAND::$HOSTCHECKCOMMAND$\tHOSTSTATE::$HOSTSTATE$\tHOSTSTATETYPE::$HOSTSTATETYPE$
[OK ] PERFDATA template looks good
[OK ] host_perfdata_file_mode is defined
[OK ] host_perfdata_file_mode=a
[OK ] host_perfdata_file_processing_interval is defined
[OK ] host_perfdata_file_processing_interval=15
[OK ] host_perfdata_file_processing_command is defined
[OK ] host_perfdata_file_processing_command=process-host-perfdata-file
[INFO] Nagios config looks good so far
[INFO] ========== Checking config values ============
service_perfdata_file_processing_command at ./verify_pnp_config_v2.pl line 462.
[OK ] Command process-service-perfdata-file is defined
[OK ] '/bin/mv /usr/local/pnp4nagios/var/service-perfdata /usr/local/pnp4nagios/var/spool/service-perfdata.$TIMET$'
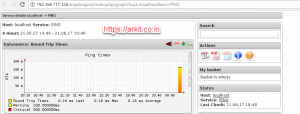
Define Action (Graph) URL so that you can see graph symbol on each and every service. Click on icon will go to appropriate pnp4nagios graph.
define service{
 use local-service ; Name of service template to use
 host_name localhost
 service_description PING
 check_command check_ping!100.0,20%!500.0,60%
 action_url /pnp4nagios/index.php/graph?host=$HOSTNAME$&srv=$SERVICEDESC$
 }
Instead of going back to pnp4nagios page you also configure to show graph popups by adding below action_url to each and every host and service
define host {
   name       host-pnp
   action_url /pnp4nagios/index.php/graph?host=$HOSTNAME$&srv=_HOST_' class='tips' rel='/pnp4nagios/index.php/popup?host=$HOSTNAME$&srv=_HOST_
   register   0
}

define service {
   name       srv-pnp
   action_url /pnp4nagios/index.php/graph?host=$HOSTNAME$&srv=$SERVICEDESC$' class='tips' rel='/pnp4nagios/index.php/popup?host=$HOSTNAME$&srv=$SERVICEDESC$
   register   0
}
That’s it, pnp4nagios installation configuration completed successfully.
How to Monitor Cronjob Execution Status
Systemctl command with all possible options
Thanks for Your Wonderful Support and Encouragement
More than 40,000 techies are part of our ARKIT community. Join us today and keep learning Linux, Cloud, Storage, DevOps, and IT technologies.


Hi, I have a check_mk 1.2.8p13 installation with pnp4nagios installed and working fine. I’m monitoring a host’s service and I would like to send by email the performance graphs generated by pnp4nagios for that service. This should be accomplished through a shell script that will run periodically in cron. My question: How can I find and call the php script that generates the graphs for a service X ? I know that in the xml definition of the .rrd I can find the php template used for generate the graphs, but I can’t find the correct way to use it to get the *.png images corresponding the graphs.
My english is not good, but I hope you’ll understand what I mean.
Thanks in advance.
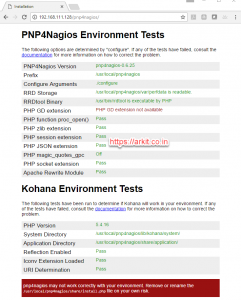
hi kindly help me in this installtion because minimum i did some 50 time every time i can see same page like this i don’t know why this is failing hear
PNP4Nagios Environment Tests
The following options are determined by “configure”. If any of the tests have failed, consult the documentation for more information on how to correct the problem.
Fatal error: Uncaught Error: Call to undefined function get_magic_quotes_gpc() in /usr/local/pnp4nagios/share/install.php:108 Stack trace: #0 /usr/local/pnp4nagios/share/index.php(140): include() #1 {main} thrown in /usr/local/pnp4nagios/share/install.php on line 108
PNP4Nagios Version pnp4nagios-0.6.25
Prefix /usr/local/pnp4nagios
Configure Arguments ./configure
RRD Storage /usr/local/pnp4nagios/var/perfdata is readable.
RRDtool Binary /usr/bin/rrdtool is executable by PHP
PHP GD extension PHP GD extension not available
PHP function proc_open() Pass
PHP zlib extension Pass
PHP session extension Pass
PHP JSON extension Pass
PHP magic_quotes_gpc
pnp4nagios is not active development, i recommended to use Centos7/RHEL7.