10 Reasons htop Command Is Getting More Popular In The Past Decade
Htop command is replacement for top command. 10 reasons htop command is more flexible then the top command, so you can see all the processes running on the system, along with their full command lines, as well as viewing them as a process tree, selecting multiple processes and acting on them all at once.
We have to use Arrow keys, Page down, Page Up keys to navigate processes
Advantages using htop command
- We can scroll vertically and horizontally
- Using single key stroke we can change process nice value
- Viewing Multiple processes yet a time and act on them
- Tree view is possible
- Interactive process viewer
- Ncurses-based process viewer for Linux
- Killing and Renice can be done on the fly with single key press
Installation of htop utility to analyse system resources. Before installing an htop utility we have to configure EPEL repository because htop package will not come along with installation media.
[root@server ~]# yum install htop*
10 reasons htop command to use
[root@server ~]# htop
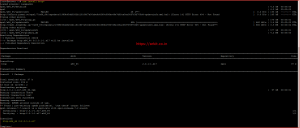
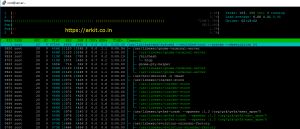
as soon as you type htop command above screenshot is the first look how htop look like
- CPU Utilisation
- Memory Utilisation
- Swap Utilisation
- How many tasks are running
- Load Average for 5Mins 10Mins 15Mins
- Uptime
Change htop command output as you like
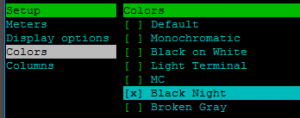
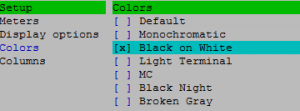
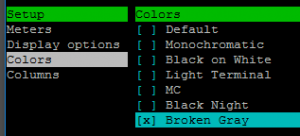
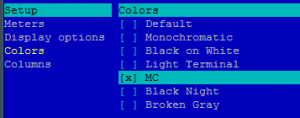
htop command output view we change using F2 key or S customise accordingly. Go to the setup screen, where you can configure the meters displayed at the top of the screen, set various display options, choose among color schemes, and select which columns are displayed, in which order.
After pressing an F2 Key select meters -> CPU (Press Space Bar) to change view
- Text View
- LED View
- Graph View
- Bar View
We can also add available meters to existing monitoring
navigate to options using arrow keys [← ↑ ↓ →] select available meters and Hit enter navigate arrow where you want to place then Hit enter
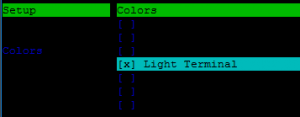
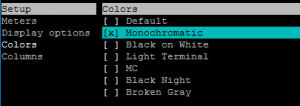
Change color themes and there views
Search processes within htop to identify required processes
To search processes we have to use F3 Key , / Key them type the process name, it straight forwardly go to mentioned name
We can filter with matched process name to filter processes F4 Key, \ Key then type the process name which you want filter with
As a example filtered with /usr/sbin
Tree View of processes 10 Reasons htop command
Tree view: organize processes by parenthood, and layout the relations between them as a tree. Toggling the key will switch between tree and your previously selected sort view. Selecting a sort view will exit tree view.
to see processes in tree view press f5 key, t key
Collapse Tree view one by one select process tree then press F6 key
Increase / Decrease Nice value of process
As a root user we can increase the process NICE value. Normal user can decrease NICE value but can’t increase NICE value. To explain this i have created a process with sleep command.
[root@server ~]# sleep 3000 &
[1] 6048
[root@server ~]# htop
F7, ] – Increase the selected process’s priority (subtract from ‘nice’ value). This can only be done by the superuser.
F8, [ – Decrease the selected process’s priority (add to ‘nice’ value)
Kill Process
Select the process which you want to kill then press F9 Key
Sort by Memory Usage and CPU Usage
Press Shift + m to sort all the process by high memory utilisation which is more useful when you want to find out which process is utilizing more
Press Shift + P to sort by high CPU utilisation
Add Refresh time
[root@server ~]# htop -d 3
above option -d which refresh every 3 seconds, if you want to refresh utilisation automatically as specified seconds then use -d option
Monitor particular PID(s)
[root@server ~]# htop -p 1
-p PID or -p PID,PID,PID to monitor particular PID’s we can just use -p option along with PID numbers
Sort by Key
[root@server ~]# htop -s PID
PID,Command,STATE,PPID,PGRP,SESSION,TTY_NR,TPGID,FLAGS,MINFLT,CMINFLT,MAJFLT,CMAJFLT,UTIME,STIME,CUTIME,CSTIME,PRIORITY,NICE,ITREALVALUE,STARTTIME,VSIZE,RSS,RLIM,STARTCODE,ENDCODE,STARTSTACK,KSTKESP,KSTKEIP,SIGNAL,BLOCKED,SIGIGNORE,SIGCATCH,WCHAN,NSWAP,CNSWAP,EXIT_SIGNAL,PROCESSOR,M_SIZE,M_RESIDENT,M_SHARE,M_TRS,M_DRS,M_LRS,M_DT,ST_UID,PERCENT_CPU,PERCENT_MEM,USER,TIME,NLWP,TGID,CTID,VPID,VXID,RCHAR,WCHAR,SYSCR,SYSCW,RBYTES,WBYTES,CNCLWB,IO_READ_RATE,IO_WRITE_RATE,IO_RATE,CGROUP,OOM,IO_PRIORITY
above are the keys we can use to sort by
Sort by User
[root@server ~]# htop -u nagios
[root@server ~]# htop -u root
We can also sort by user which means only particular user processes will be listed. 10 reasons htop command
htop command columns
- PID – Process Identification Number
- USER – User Name
- PRI – priority of the process 20 is low 1 is High
- NI – Nice value of the process
- VIRT – Virtual memory utilisation
- RES – The resident set size (text + data + stack) of the process
- SHR – Size of Shared pages
- S – State of the process
- S for sleeping (idle)
R for running
D for disk sleep (uninterruptible)
Z for zombie (waiting for parent to read its exit status)
T for traced or suspended (e.g by SIGTSTP)
W for paging - CPU% – CPU utilisation
- MEM% – memory utilisation
- TIME+ – How long the process is running
- COMMAND – full path of the command
There are N number of options and features are there by using htop utility
That’s about htop command utility
Related articles
25 Linux commands which are more useful
sed command with 20 practical examples
netstat command to monitor and troubleshoot netwotk utilisation
Thanks for Your Wonderful Support and Encouragement
More than 40,000 techies are part of our ARKIT community. Join us today and keep learning Linux, Cloud, Storage, DevOps, and IT technologies.
