Top 5 Enterprise opensource monitoring tools
Top 5 Enterprise Opensource Monitoring Tools
Most of the organizations works an servers to develop code, generate productivity so on. If suddenly Server goes down OR Network device goes Down there is a big question mark for all System Administrators, Managers and Engineers. Get ride of unknown server down. No need ping the servers to see whether servers are running. Just install and configure any of these monitoring tools that’s it, they will monitor all servers, services and network devices whenever any device / service stopped they will send us an alert via Email OR SMS.
In this article we are going to see most popular Top 5 Enterprise opensource monitoring tools
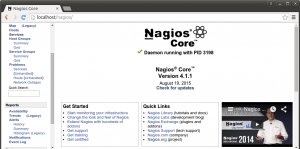
1. Nagios
Nagios project is started in 1999. Nagios Enterprise monitoring tool will monitor your entire IT infrastructure to ensure systems, applications, services and business process are functioning properly. Which has two types of Software’s one is Nagios Core which is fully free (opensource) we have to configure everything by our own. Another one is Nagios XI which has beautiful GUI interface it is very easy to configure monitoring.
Nagios monitors your entire IT infrastructure to ensure systems, applications, services, and business processes are functioning properly. In the event of a failure, Nagios can alert technical staff of the problem, allowing them to begin remediation processes before outages affect business processes, end-users, or customers. With Nagios you’ll never be left having to explain why an unseen infrastructure outage hurt your organization’s bottom line.
Few Advantages using Nagios Core
- Monitor your entire IT infrastructure
- Spot problems before they occur
- Know immediately when problems arise
- Share Available data with stakeholders
- Detect security breaches
- Plan and budget for IT upgrades
- Schedule Planed down times
Download Nagios Core
Nagios Core Installation and configuration Guide
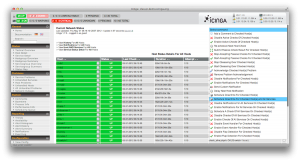
2. Icinga
Monitoring Servers and networking devices with icinga2 is very easy. You can download and add plugins as many as like. No need to make set-up or maintenance of the monitoring system itself any more complex. That’s why Icinga 2 features a new configuration format that is intuitive to write, efficient to execute and even adjusts to the changing conditions of your environment at run-time.
Clear-cut, object-based configuration
Icinga 2 introduces a new object-based, rule-driven configuration format, which offers user-friendly features such as apply rules for dynamic object generation.
Taking inspiration from Puppet formats, Icinga 2 offers clear, “one best way” configuration rules. This allows Icinga 2 to depart from Nagios(TM)’s multiple configuration formats (e.g. defining host/service dependencies and parent/child relationships for hosts) – the cause of much user confusion.
The Icinga 2 configuration format is currently set as text files, in preparation for later transition to configuration via API, or GUI and CLI. A configuration migration script that translates existing Icinga 1 / Nagios configurations into the new Icinga 2 format also makes migration easier.
Apply & assign attributes
Keep configuration work to a minimum by defining templates to ”apply” to configuration objects. Apply services and notifications to hosts, or downtimes and dependencies to services.
Clever commands & runtime macros
Commands in Icinga 2 are smarter than their Nagios™-style cousins. To begin with, Icinga 2 offers three distinct command types: Check, notification and event commands. They can be given default values, custom attributes, runtime macros and conditional behaviours. Each additional option can be given precedence over the other, so that your configuration intelligently adapts at runtime to changing monitoring conditions.
Logical Dependencies
Say goodbye to confusing parent/child relationships. Dependencies in Icinga 2 are straightforward; they can be defined as host-host, service-service or mixed (host-service and service-host) and all work in the same manner.
Dynamic Notifications
Similar to Icinga 1, event handlers and notifications are supported. Thanks to the new dynamic configuration format, users can adjust notification settings at runtime (e.g. in order to implement on-call rotation).
For example, new notification objects replace notification-specific attributes for services, while user and user groups replace contact and contact groups. This new format allows notifications to be defined more precisely and intuitively. On top of this, escalations in Icinga 2 are configured as notifications with a defined beginning and end, as are recurring downtimes.
Download Icinga
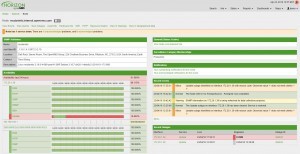
3. OpenNMS
OpenNMS is the world’s first Enterprise opensource monitoring tool. Which is capable of monitoring Servers and Networking devices using SNMP protocol. OpenNMS has more and more features such as
- Automated and Directed discovery and provisioning
- Event and Notification Management
- Service Assurance
- Performance Measurement
Open Source: OpenNMS is 100% Free and Open Source software, with no license fees, software subscriptions or special “enterprise” versions.
Download OpenNMS
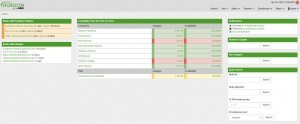
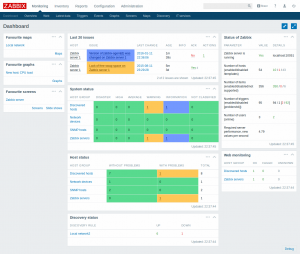
4. zabbix
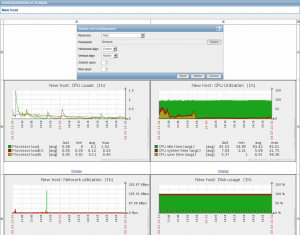
Using zabbix enterprise level monitoring tool, we can monitorr real time thousands of servers, networking devices, virtual machines simultaneously. Along with storing the data, visualization features are available (overviews, maps, graphs, screens, etc), as well as very flexible ways of analyzing the data for the purpose of alerting. Zabbix offers great performance for dat gathering and can be scaled to very large environments.
Features
- Monitor Everything
- Enterprise Ready
- Proactive Monitoring
- Capacity Planning
- True Open Source
- Business Solutions
Download Zabbix
5. cacti
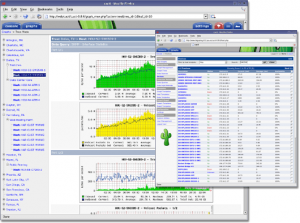
Cacti mainly used for Network device monitoring. We can create templates. Download performance data as CSV and we can do whatever we want. User Management and graphs. Cacti makes use of RRDTool to generate graphs and collect data from Networking devices. The frontend is completely PHP driven. Along with being able to maintain Graphs, Data Sources, and Round Robin Archives in a database, cacti handles the data gathering. There is also SNMP support for those used to creating traffic graphs with MRTG.
Features
- Graphs
- Datasources
- Data Gathering
- Template creation
- Graph Display
- User Management
- Graph templates enable common graphs to be grouped together by templating. Every field for a normal graph can be templated or specified on a per-graph basis.
- Data source templates enable common data source types to be grouped together by templating. Every field for a normal data source can be templated or specified on a per-data source basis.
- Host templates are a group of graph and data source templates that allow you to define common host types. Upon the creation of a host, it will automatically take on the properties of its template.
- The tree view allows users to create “graph hierarchies” and place graphs on the tree. This is an easy way to manage/organize a large number of graphs.
- The list view lists the title of each graph in one large list which links the user to the actual graph.
- The preview view displays all of the graphs in one large list format. This is similar to the default view for the 14all cgi script for RRDTool/MRTG.
Download Cacti
That’s About Top 5 Enterprise opensource monitoring tools
Please do comment your feedback
Top 5 Enterprise opensource monitoring tools Top 5 Enterprise opensource monitoring tools Top 5 Enterprise opensource monitoring tools Top 5 Enterprise opensource monitoring tools Top 5 Enterprise opensource monitoring tools
Thanks for your wonderful Support and Encouragement
- Get Email | Download E-Books
- Facebook Page
- Youtube Channel
- Exclusive Telegram Group
- Discuss On WhatsApp Group



I have used Nagios and I can tell you it is the best one
thanks for your valuable reply.
For me, the best is pandorafms
i want to monitoring tool tivoli and ticketing tool bmc remedy
Those are not OpenSource Monitoring tools