10 top command practical examples helps to analyze server performance
Top command provides a dynamic real-time view of a running system. It can display system summary information as well as list of processes of threads currently being managed by Linux Kernel. Top Command provides a limited interactive interface for process manipulation as well as a much more extensive interface for personal configuration. We are going to see 10 top command practical examples helps to analyze server performance.
10 top command practical examples helps to analyze server performance
Syntax: top -hv|-bcHiOSs -d secs -n max -u|U user -p pid -o fld -w [cols]
When Started top for the first time you’ll be presented with three area’s as shown in below screenshot
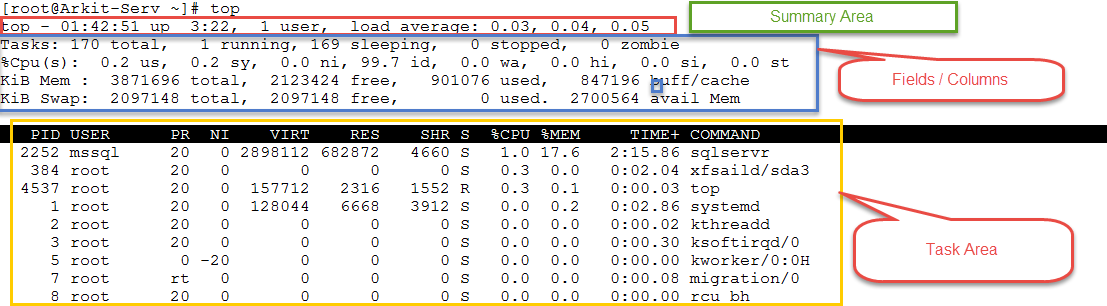
Let’s divide each line as one row then we are going to discuss each and every row what each column means.
Row1:
top - 01:56:28 up 3:36, 1 user, load average: 0.05, 0.06, 0.07
01:56:28 – System time
up 3:36 – Server uptime 3Hours and 36 Minutes
Load average 0.05 (Every 1 min average) 0.06 (Every 5 Minutes average) 0.07 (Every 15 Minutes Average)
Row2:
Tasks: 171 total, 1 running, 170 sleeping, 0 stopped, 0 zombie
2 row will provides you details about tasks and there status. It simple and straight forward that total processes, Running processes, Sleeping Processes, Stopped Processes and Zombie Process.
Zombie Processes are the processes which are died and still in process queue.
Row3:
%Cpu(s): 0.0 us, 0.0 sy, 0.0 ni,100.0 id, 0.0 wa, 0.0 hi, 0.0 si, 0.0 st
3row gives you an cumulative CPU(s) usage in various aspects Let’s see what are those
0.0 us – User running process percentage of CPU
0.0 sy – System running process CPU percentage
User Running (us) + System Running (sy) = Total CPU Used
ni, nice : time running niced user processes
id, idle : time spent in the kernel idle handler
wa, IO-wait : time waiting for I/O completion
hi : time spent servicing hardware interrupts
si : time spent servicing software interrupts
st : time stolen from this vm by the hypervisor
Memory and Swap Utilization
Row4:
KiB Mem :  3871696 total,  2123424 free,   901076 used,   847196 buff/cache
KiB Swap:  2097148 total,  2097148 free,        0 used.  2700564 avail Mem
4 Row provides Memory (RAM) and Swap Utilization. “Buffers” represent how much portion of RAM is dedicated to cache disk block. “Cached” is similar like “Buffers”, only this time it caches pages from file reading.
R0w5:
PID USER PR NI VIRT RES SHR S %CPU %MEM TIME+ COMMAND
Process Identify (PID) Every command/script/task you run an command/GUI will be assigned with UNIQ process ID with round robin mechanism.
USER – Which user run the command/script
PR – Priority of the task execution value 0 is an high priority and value 40 is low.
NI – Nice Value -20 is an high value and 20 is an low value
VIRT – Virtual Memory Size (KiB). The total amount of virtual memory used by the task.
RES – Resident Memory Size (KiB). The non-swapped physical memory a task is using.
SHR – Shared Memory Size (KiB). Amount of shared memory available to a task, not all of which is typically resident.
S — Process Status
D = uninterruptible sleep
R = running
S = sleeping
T = stopped by job control signal
t = stopped by debugger during trace
Z = zombie
%CPU – CPU Usage
%MEM – Memory allocate to the task to perform
TIME – Time elapsed for particular task execution
COMMAND – executed command name / path
Top Command options / operation
Capturing top command output to file analyze server performance
[root@Arkit-Serv ~]# top -b -n 1 > topoutfile
Expanding full command path
After entering into top command just hit ‘c’ COMMAND column will expand example as shown below
COMMAND
/opt/mssql/bin/sqlservr
/usr/bin/python -Es /usr/sbin/tuned -l -P
sshd: root@pts/0
/usr/lib/systemd/systemd --switched-root --system --deserialize 21
[kthreadd]
[ksoftirqd/0]
Kill particular process using top option ‘k’ when you press k key it will ask you to provide PID and signal which you want to send kill signal is 9. see all signals using kill -l command
PID to signal/kill [default pid = 1] 5573
Send pid 1 signal [15/sigterm] 9
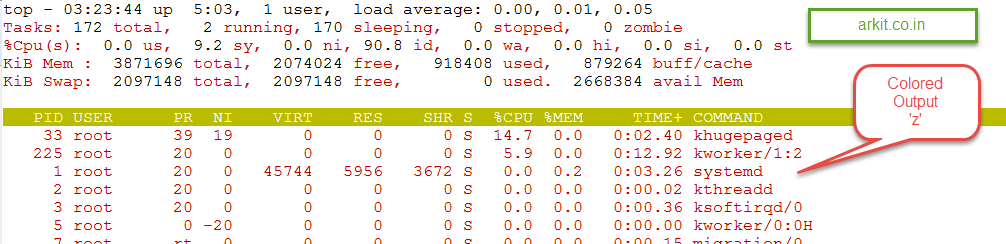
Colored output using ‘z’ key
Few More 10 top command options
r – Re-nice a Process
1 – shows the details of individual CPU’s running on the System.
d – Press change refresh Rate by default top refresh time 3 seconds
h – help
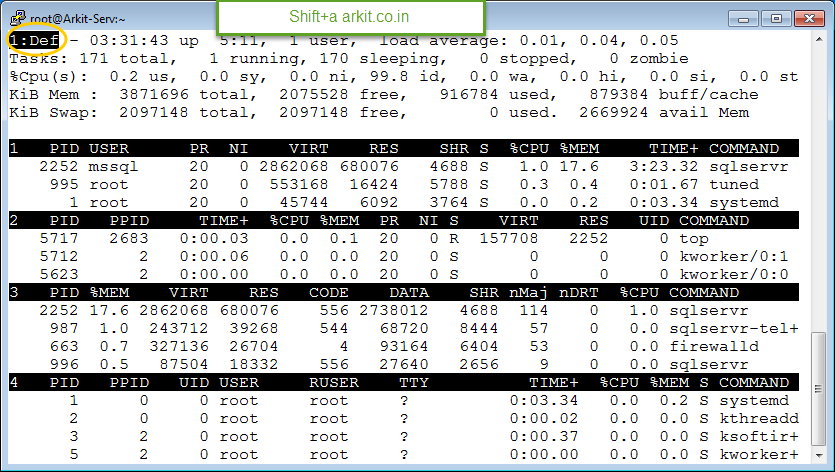
A – Split top output to Multiple Screens
n – Reduce number of listed process
l – Hide / Show Load Average
t – Hide / show 2nd and 3rd Header line and Change CPU Usage state into bar
m – show / hide 4th and 5th line of top output and also change memory and swap utilization to bar
Particular User usage
top - u username
Watch particular PID how it’s going analyze server performance
top -p PID
Number of iterations after that top will close automatically
top -n 2
Thread of the process watch
top -H -p PID
That’s it about 10 top command practical examples to analyze system performance.
htop command ultimate full colored output
Thanks for your wonderful Support and Encouragement